BusinessCycleClock
 Business Cycle Clock
help
What is the business cycle clock?
It is a tool* with a visual display like a clock in which the location of the principal economic indicators are displayed within 4 quadrants.
* The business cycle clock is a concept that was created and developed by Statistics Netherlands.As interest in economic indicators has been increasing throughout the process of recovery from the financial crisis, Statistics Korea developed the BCC to provide a diverse range of services.
We anticipate that by graphically displaying the data, it will become easier for citizens to understand economic indicators at a glance and that the Korean people’s understanding about economic indictors and business cycles will increase.
The working principle of the business cycle clock
The time-series design process utilized to establish the economic indicator values of the business cycle clock is as follows;
- Calculate the seasonally-adjusted series (removing seasonality by using X-13-ARIMA-SEATS).
- Extract the trend components from the seasonally-adjusted series.
- Extract the cyclical components from the trend-free cyclical and irregular components.
- Calculate the mean and standard deviation from the extracted cyclical components and change it to a standardized series(mean 0, standard deviation 1).
- The Y-axis of the business cycle clock represents the deviation(the value of the cyclical component) from the trend line, and the X-axis represents MoM increase, which represents change of the cyclical components during different periods.
- After subtracting the cyclical component series from the economic indicators, locate the MoM changes(X) and cyclical component series(trend line deviation) in the (X,Y) coordinates.
The business cycle clock divides the business cycles into 4 phases <picture 1>.
The 4 phases are: The expansion phase which is from point (A) to the peak (B), the slowdown phase which is from the peak (B) to point (C), the recession phase which is from point (C) to the trough (D) and the recovery phase which is from the trough (D) to point (E).
* Commonly, the business cycle is divided in two or four phases. The business cycle with two phases is composed of the expansion phase in which economic activities are very active from the trough to the peak, and the recession phase in which economic activities are contracting from the peak to the trough.<Picture 1 Cyclical component series and business cycle clock>

<Picture 1> The X-axis represents MoM increase of the cyclical components, and the Y-axis represents the cyclical components(trend line deviation).
If you activate the business cycle clock, it operates in accordance with the following time-line : [1st phase]expansion phase(green quadrant) -> [2nd phase]slowdown phase(orange quadrant) -> [3rd phase]recession phase(red quadrant) -> [4th phase]recovery phase(yellow quadrant).
The contents of each phase are as follows; [1st phase] green quadrant: MoM increase of economic indicators(cyclical components), above trend [2nd phase] orange quadrant: MoM decrease of economic indicators(cyclical components), above trend [3rd phase] red quadrant: MoM decrease of economic indicators(cyclical components), below trend [4th phase] yellow quadrant: MoM increase of economic indicators(cyclical components), below trend
How to use the business cycle clock
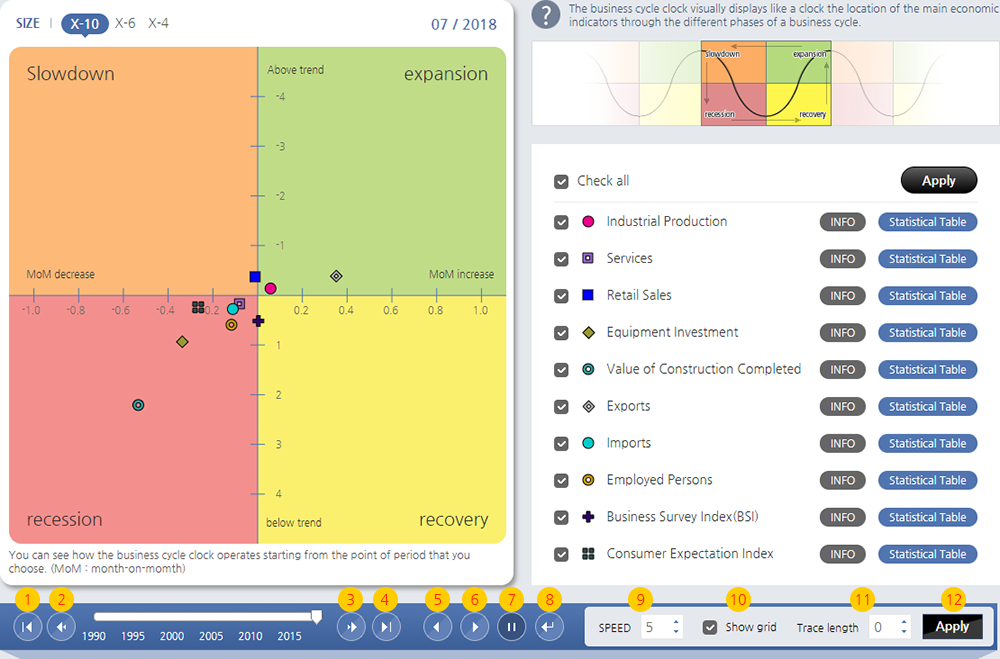
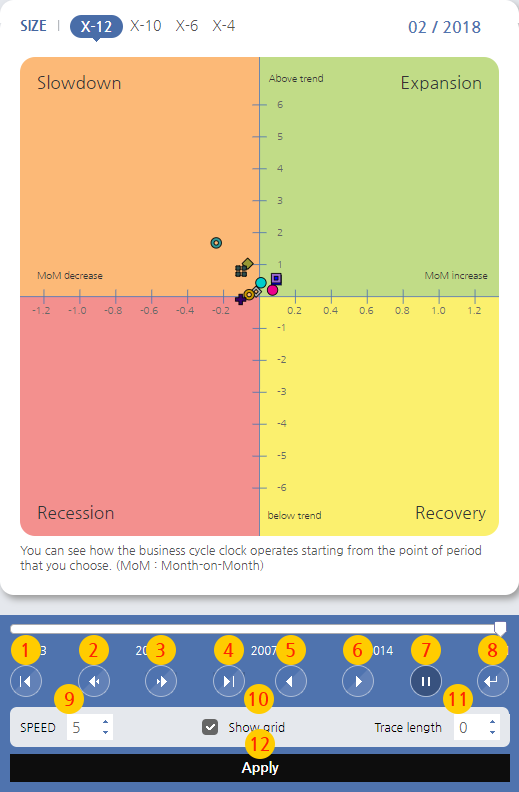
The business cycle clock is composed of a clock screen, control buttons and indicator selection screen. If you use the “play” button in the “control buttons” at the bottom of the screen, you will see how the indicators move within the 4 quadrants. Depending on the button that you select, you can check the results of the previous month and the following month in addition to viewing movement from the beginning or the end with the options to stop, replay or change the speed. You can see also that the selected month and year is displayed at the top of the clock.
The location and movement of specific indicators can be viewed by clicking on the check-box in front of the indicators’ name (ex:  ), which is on the "indicator selection screen" located on the right side. Also, you can see a scale of both X-and Y-axis by checking(
  ) at the bottom right side of the screen.
Click the button (  ), and the KOSIS table of the selected indicator will be connected. The button
  (abbreviation of information)provides a brief description of the indicator.

- To the beginning
- Previous month
- Next month
- To the end
- Play animation(backward)
- Play animation(forward)
- Stop
- Repeat
- Play speed
- Show grid
- Trace length
- Apply
* See the business cycle clock screen of reference date.
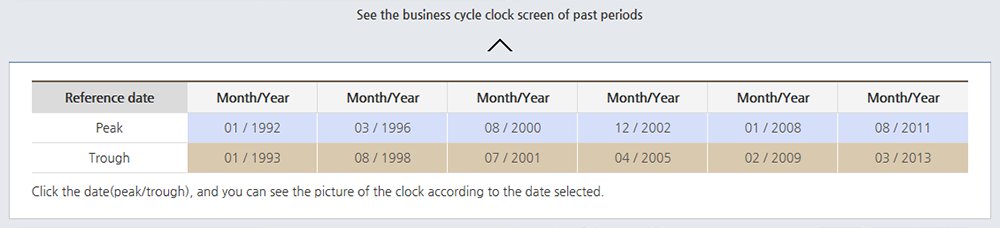
Click "See the business cycle clock screen of reference date", and a table will appear that shows the reference date. This displays Korea’s past peaks and troughs, and when you click on any peak or trough, the clock screen of the selected period will be displayed and you can see the location of indicators within the 4 quadrants.
Recent movements of the main economic indicators according to the business cycle clock
- (Second half of 2008) Indicators recorded big falls after the global financial crisis.
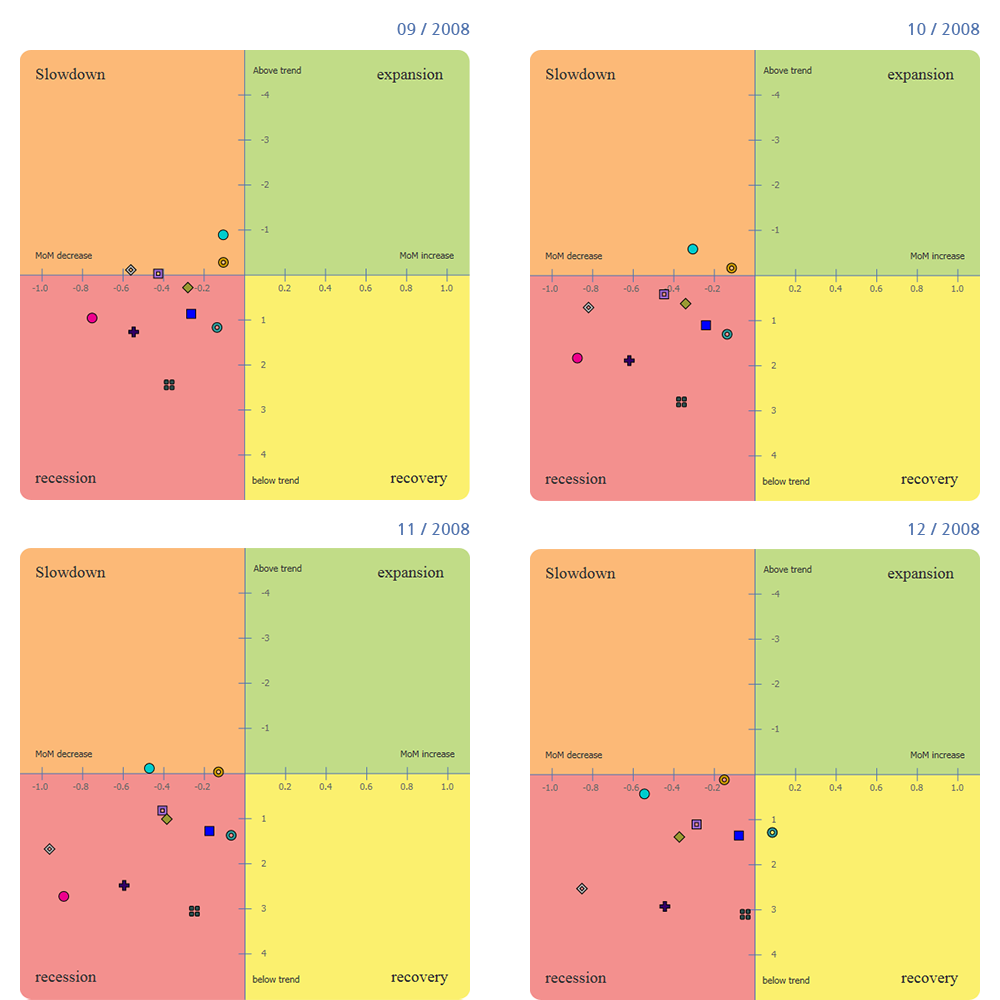
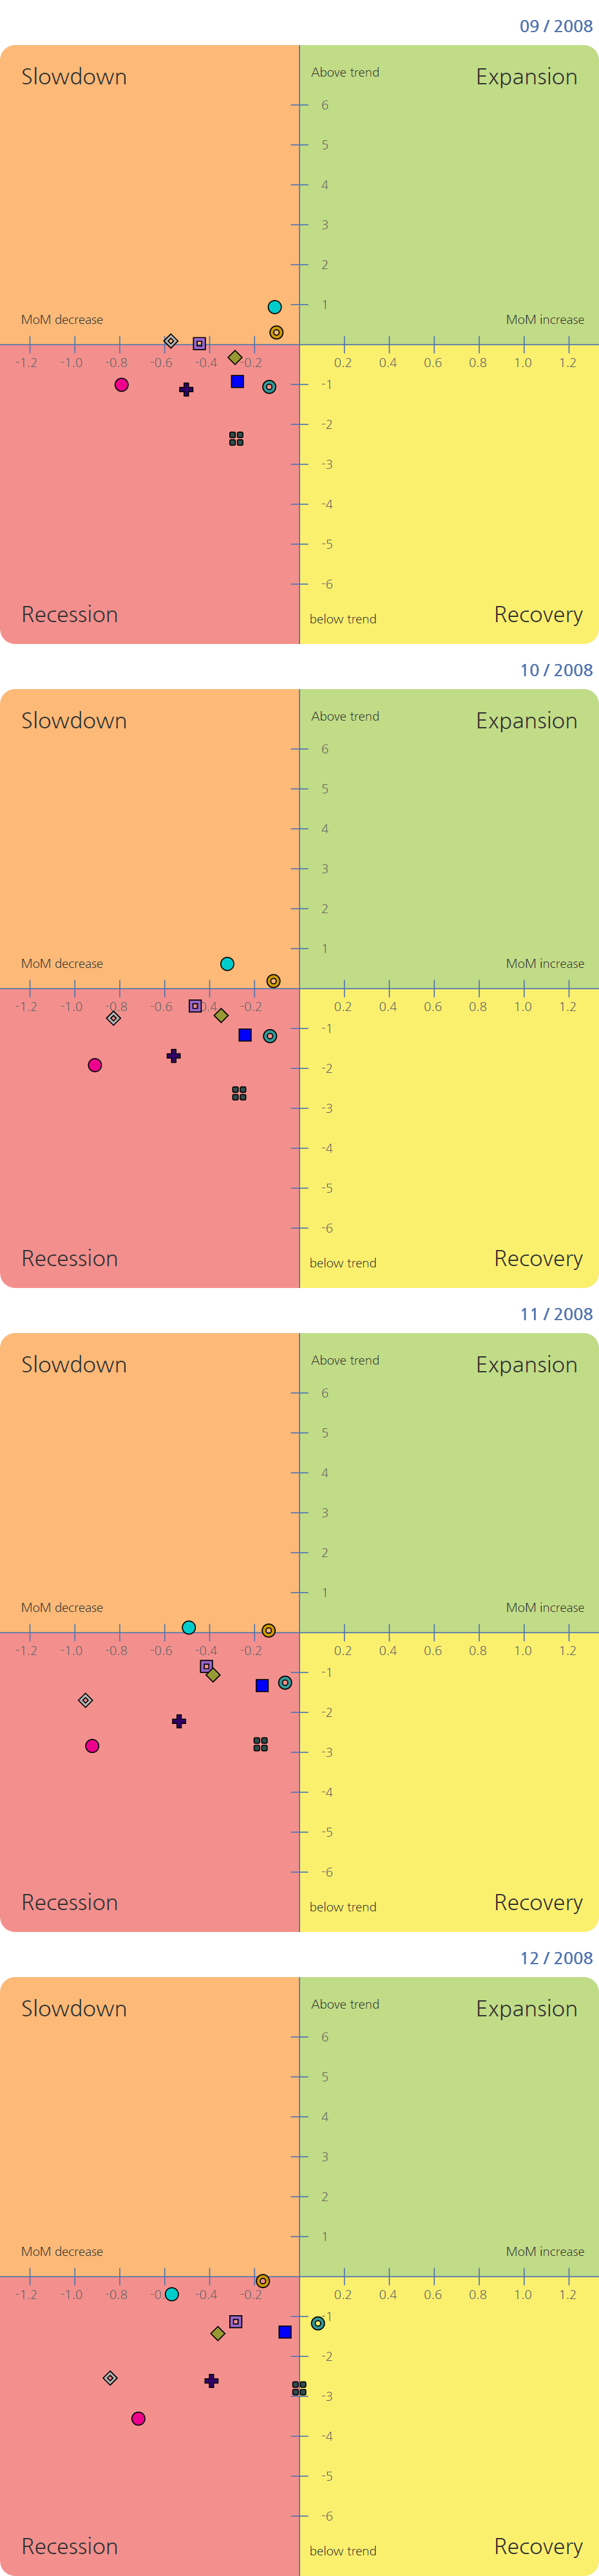 ⇒ Most of the economic indicators fell dramatically for continuous 4 months (September ~ December, 2008).
- (First half of 2009) Indicators rapidly recovered from the crisis.
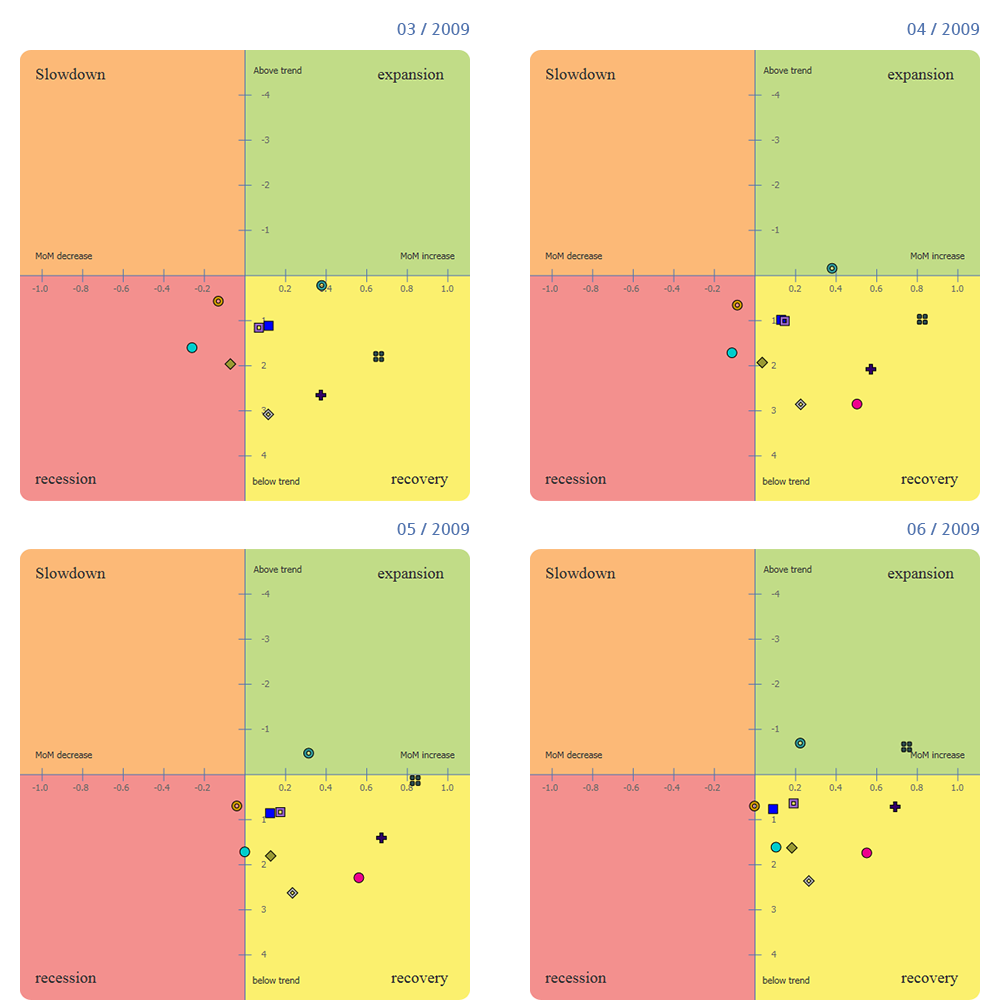
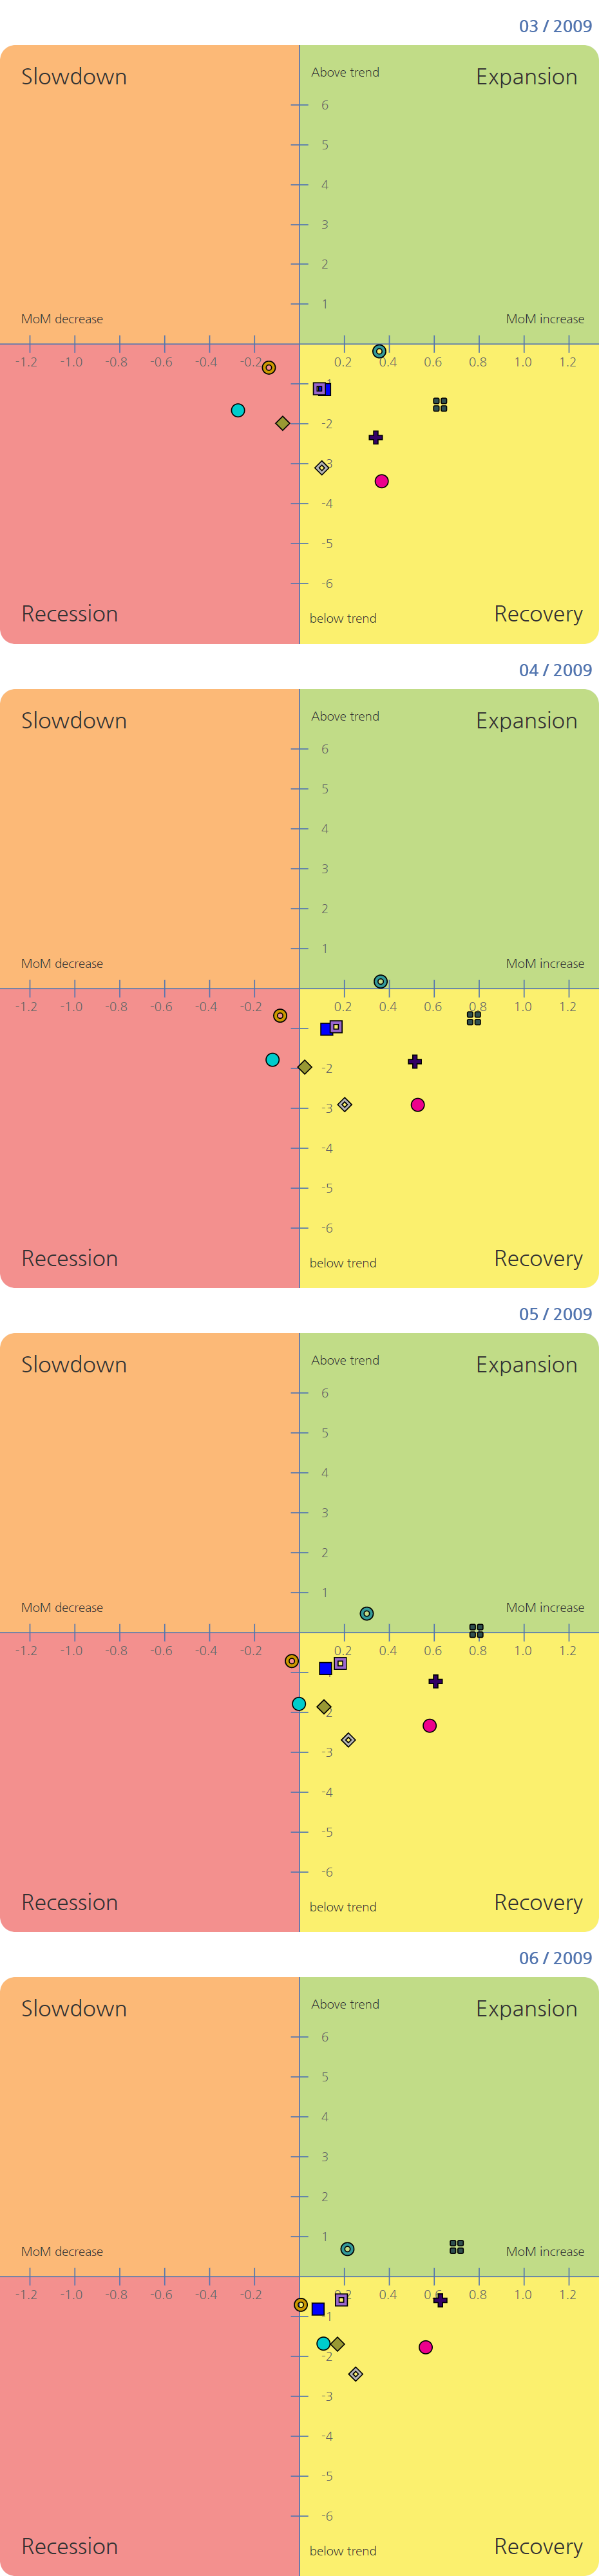 ⇒ Most of the economic indicators rapidly recovered for 4 months in a row (March ~ June, 2009).
What is a cyclical component?
The economic indicators are normally composed of the following 4 components:
Non-cyclical factors
- Seasonal components :
- Changes within 1-year period such as seasonal changes.
- Irregular components :
- Short-term and incidental changes such as natural disasters, labor union strikes, etc.
Cyclical factors
- Trend components :
- Long-term changes caused by population growth, accumulation of capital, technical developments, etc.
- Cyclical components :
- Components related to economic cycles.
The business cycle clock concentrates on cyclical components excluding seasonal, irregular and trend components.
What is the reference date?
The reference date is the turning point where a phase transition occurs. It consists of a peak where a phase transition occurs from an expansion phase to a recession phase and a trough where a phase transition occurs from a recession phase to an expansion phase.
The cycle reference date is used as a standard to evaluate the economic response and usefulness of the economic balancing policies and to classify each economic indicator into leading, coincident and lagging economic indicators. And it is a judgment basis when studying characteristics of business cycle and behaviors of fluctuations.
The Korean reference date is officially decided and announced by Statistics Korea through analyzing the movement of economic indexes and economic indicators such as GDP and industrial production, and the analysis is reviewed by the National Statistics Committee with the consultation of experts.

You can see how the business cycle clock operates starting from the point of period that you choose. (MoM : Month-on-Month)
-
slowdown
If the economic indicator’s icon is on the orange zone,
it means that the indicator recorded a MoM decrease and its trend is above. close -
expansion
If the economic indicator's icon is on the green zone,
it means that the indicator recorded a MoM increase and its trend is above. close -
recession
If the economic indicator's icon is on the red zone,
it means that the indicator recorded a MoM decrease and its trend is below. close -
recovery
If the economic indicator's icon is on the yellow zone,
it means that the indicator recorded a MoM increase and its trend is below. close
Indicator setting
- INFO
Statistical Table
Industrial Production
COPYRIGHT(c) STATISTICS KOREA. ALL RIGHTS RESERVED. - Definition : It is the index of production by mining, manufacturing, and electricity and gas industry with the 2020 monthly production average considered as 100 base. - Source : Mining and Manufacturing Industry Trend Research by Statistics Korea - Scope : 490 main products from mining, manufacturing and electricity and gas industry according to the Korea Standard Industrial Classification(KSIC). - Research subjects : Aprox. 7,800.
 - INFO
Statistical Table
Industrial Production
COPYRIGHT(c) STATISTICS KOREA. ALL RIGHTS RESERVED.
- Definition : It is a monthly index of the service industry production with 2020 as base year(2020=100). The value added weight of each sector of the service industry is applied in the index, which represents the relative importance of each sector. The index has the purpose of understanding both the production activity of the whole and each sector of the service industry. - Source : Service Industry Trend Research by Statistics Korea - Scope : 13 main categories related to the service industry from the Korea Standard Industrial Classification(KSIC). - Research subjects: Aprox. 17,300. - INFO
Statistical Table
Industrial Production
COPYRIGHT(c) STATISTICS KOREA. ALL RIGHTS RESERVED.
- Definition : Monthly index of automobiles(451) and retail sales(47) from the Service Industry Trend Research, with 2020 as base year(2020=100). The purpose of the index is to show the consumption trend. - Source : Service Industry Trend Research by Statistics Korea - Scope : Automobile sales(451) and retail sales(47) from the Korea Standard Industrial Classification(KSIC). But, retail sales exclude the sales of used products, retail sales via stalls and similar mobile retail sales and other outlet shop sales. - Research subjects : Aprox. 3,700. - INFO
Statistical Table
Industrial Production
COPYRIGHT(c) STATISTICS KOREA. ALL RIGHTS RESERVED.
- Definition : Monthly index of the estimation of equipment investment amount (fixed amount) using 2015 as base year(2015=100), with the purpose of understanding the domestic equipment investment trend. The estimation is calculated using the so-called 'Simplified commodity flow method'. It is based upon the assumption that we can obtain the equipment investment portion by substracting the intermediate consumption, final consumption, changes in inventories, and exports from the aggregate supply of equipment investment goods defined by the sum of domestic production and imports of equipment goods. * equipment investment = (domestic shipment + imports) - intermediate demand - consumption - Source : Mining and manufacturing research, industrial production and producer's inventory index by Statistics Korea. - Scope : 65 sectors which are composed of total of 381 basic categories. - INFO
Statistical Table
Industrial Production
COPYRIGHT(c) STATISTICS KOREA. ALL RIGHTS RESERVED.
- Definition : Total amount of completed constructions during the research period(1st ~ last day of the previous month). - Source : Construction Business Cycle Trend Research by the Statistics Korea. - Scope : Domestic construction from the「F.Construction Industry」category of the Korea Standard Industrial Classification(KSIC) - Research subjects : Construction companies registered under the Minister of Land, Transport and Maritime Affairs, which have high level of construction completion and maintain 50% of the main construction plan. - INFO
Statistical Table
Industrial Production
COPYRIGHT(c) STATISTICS KOREA. ALL RIGHTS RESERVED.
- Source : Trade Statistics by Korea Customs Service - Contents : Products - Food material, direct consumer goods, raw materials and fuel, light industry products, heavy chemical products. - Deflator : Export prices index (in dollars). - INFO
Statistical Table
Industrial Production
COPYRIGHT(c) STATISTICS KOREA. ALL RIGHTS RESERVED.
- Source : Trade Statistics by Korea Customs Service - Contents : Products - consumer goods, capital goods, raw materials - Deflator : Import prices index (in dollars). - INFO
Statistical Table
Industrial Production
COPYRIGHT(c) STATISTICS KOREA. ALL RIGHTS RESERVED.
- Definition : Person who worked more than 1 hour during the research period (the week in which the 15th day of the month is) with the purpose of obtaining income. - Source : Economically Active Population Survey by Statistics Korea - Research subjects : Person living within the sample population area of 35,000 households, and is more than 15 years old at each 15th day of the month. - INFO
Statistical Table
Industrial Production
COPYRIGHT(c) STATISTICS KOREA. ALL RIGHTS RESERVED.
- Definition : An indexed and compounded survey that provides information about the manufacturing industry’s performance. The survey contains the performance and future outlook of each corporate’s main business activities such as industry’s current conditions, sales and profitability. - Source : The Bank of Korea’s Business Survey. - Research subjects : Total of 3,696 corporations in Korea (23 manufacturing companies, 13 non- manufacturing companies). - INFO
Statistical Table
Industrial Production
COPYRIGHT(c) STATISTICS KOREA. ALL RIGHTS RESERVED.
- Definition : It represents the consumer's expectations of domestic economic situation, living standards and consumer spending plan 6 months later. - Source : The Bank of Korea’s Consumer Survey(before August 2008, Statistics Korea's Consumer Prospect Survey) - Research households : Sample of 2,500 households living in cities. - Research period : The week in which the 15th day is.


- See the business cycle clock screen of past periods


-
Click the date(peak/trough), and you can see the picture of the clock according to the date selected.See the business cycle clock screen of past periods. Reference date Month/Year Month/Year Month/Year Month/Year Month/Year Month/Year Month/Year Peak 01 / 1992 03 / 1996 08 / 2000 12 / 2002 01 / 2008 08 / 2011 09 / 2017 Trough 01 / 1993 08 / 1998 07 / 2001 04 / 2005 02 / 2009 03 / 2013 05 / 2020
The graph of the business cycle clock in July
According to the business cycle clock in July, Industrial Production, Retail Sales, Equipment Investment, Exports, Consumer Expectation Index are located in the expansion phase(green quadrant),
Services, Value of Construction Completed, Business Survey Index(BSI) are located in the Recovery phase(yellow quadrant),
Imports is located in the slowdown phase(orange quadrant),
Employed Persons is located in the recession phase(Red quadrant).

In comparison with June business cycle clock, Industrial Production, Retail Sales, Equipment Investment, Exports, Consumer Expectation Index, Services, Value of Construction Completed, Business Survey Index(BSI) are increased,
Imports, Employed Persons are decreased.
Each quadrant has the following meaning.

○ Green quadrant : MoM increase of economic indicators(cyclical change components), above trend
○ Orange quadrant : MoM decrease of economic indicators(cyclical change components), above trend
○ Red quadrant : MoM decrease of economic indicators(cyclical change components), below trend
○ Yellow quadrant : MoM increase of economic indicators(cyclical change components), below trend

Note

1. Individual indicators of the business cycle clock are made by using a cyclical component where seasonal, irregular and trend factors are removed
   and cyclical component’s monthly change, so its direction might be different form the original series or the seasonally adjusted series.

2. Each of the individual indicators’ latest location within the 4 quadrants might change as data is renewed every month due to the filtering method of the cyclical component.

3. The business cycle clock is scheduled to be updated near the beginning days of every month.

September 10, 2025 updated